Methane Payments and Tropical Forest Project Finance
We calculate the costs and income of a forest-carbon project in each eligible square-kilometre grid cell across the tropics. The model tests whether each project can meet a 12% annual return over 30 production years. We use GWP20 for the main methane payment calculation and compare it with GWP100 and GWP*, using the same methane uptake.
GWP20 methane factor: 81.2 tCO₂e/tCH₄Assumed unit price: $50Revised: 19 September 2026
01
How Methane Payments Change the Model Results
We assume buyers pay $50 per tonne of CO₂ stored in biomass and $50 per methane unit. The methane metric determines how uptake is converted into payment units. GWP* also accounts for how uptake changes over time. GWP* payments assume buyers and registries accept it from the start of the project. Mha means million hectares.
+5.0 Mha
of land becomes financially viable with GWP20 payments
Biomass carbon revenue alone makes 62.5 million hectares viable. Methane payments allow more grid cells to meet the required return.
GWP100: +1.8 Mha. Conditional GWP*: +6.1 Mha.
4.3%
is the reduction in peak funding need with GWP20 payments
We average each cell's largest accumulated cash shortfall over the 62.5 million hectares already financially viable without methane. Each cell is weighted by its area. Methane payments reduce the average funding need by $48 per hectare. We do not include advance purchases before planting.
GWP100: 1.6%. Conditional GWP*: 5.4%.
+2.24 Mha
more forest is completed in the central GWP20 calculation
This calculation covers land already financially viable without methane. It assumes that higher returns help projects complete more forest. We have not fitted that relationship to project records.
GWP100: +0.78 Mha. Conditional GWP*: +2.84 Mha.
We report the area that becomes financially viable separately from the extra area completed. We do not add them together. The model does not give a separate area for projects that avoid failure after planting.
02
How Prices and Forest Growth Affect the Results
Assumed Purchase Prices
We tested three assumed patterns of purchase prices. Methane payments make an additional 1.8 to 4.6 million hectares financially viable using GWP20, 0.7 to 1.5 million hectares using GWP100, and 2.2 to 5.7 million hectares using GWP* if buyers and registries accept it. These price patterns do not come from observed transaction volumes.
Uncertainty in Forest Growth
In the middle 50% of results, methane payments make 3.4 to 7.4 million more hectares financially viable under GWP20. We vary forest growth using a lognormal distribution with a 30% coefficient of variation and no change in mean growth. Each run applies the same proportional change across the landscape. Methane uptake and prices stay fixed. All payment calculations use the same growth changes. The range shows how the results respond to this growth assumption. It does not include all sources of model uncertainty.
Crediting Deductions
The central calculation multiplies gross quantities by 0.82 for the buffer and 0.90 for leakage, leaving 0.738 of the original amount. A separate conservative calculation deducts a further 36% for underdelivery. We retain this assumption to test how the results change; it does not come from measured reforestation outcomes. With this deduction, 32.0 million hectares remain financially viable without methane.
Forest Protection
In the central calculation using Hansen data and a frontier baseline, GWP20 payments make protection financially viable on an additional 0.09 million hectares. GWP100 adds 0.05 million hectares. GWP* adds 0.10 million hectares if buyers and registries accept it. The full analysis compares all eight combinations of data, baselines and latitude ranges.
03
Where Biomass Carbon Revenue Could Fund Reforestation
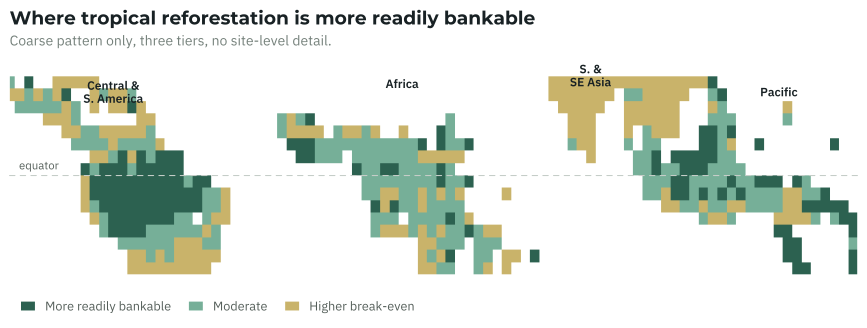
This map groups the prices needed for reforestation to meet the required return using biomass carbon revenue alone. Changing the methane metric does not change these prices. The map omits project boundaries and local detail.
Much of the difference between locations comes from mapped forest growth and net agricultural income. The model also assigns project types and fixed costs.
04
When Methane Uptake and Payments Occur
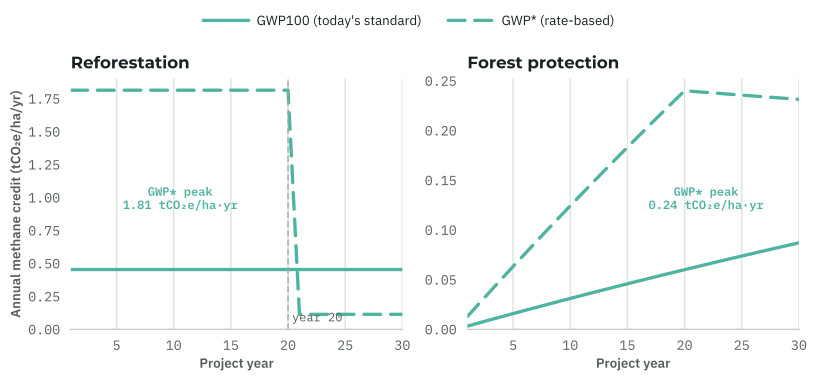
For reforestation, the model assumes zero additional uptake before the project and full mature-forest uptake from production year 1. This pattern has not been tested in restored forests. For forest protection, preserved uptake grows as more forest loss is avoided. Payments arrive one year after uptake, in years 2 to 31.
All metrics use the same methane uptake over time. GWP* accounts for current uptake and uptake over the previous 20 years. The GWP* payment calculation assumes buyers and registries accept it from the start of the project. The model does not calculate the value of switching to GWP* later.
05
Annual CO₂ and Methane Removal From More Completed Forest
In the GWP20 calculation, the extra completed forest removes 33.4 million tonnes of CO₂ in biomass and 0.0279 million tonnes of methane per year once it reaches the modeled full annual rate. These amounts include the modeled buffer and leakage deductions. The methane equals 2.26 million tonnes CO₂e per year using GWP20. Together, the two amounts equal 35.7 million tonnes CO₂e per year using GWP20.
This calculation covers extra completed forest on land already financially viable without methane, after biomass reaches its full rate. It does not predict how much forest will be completed. The total excludes the methane-carbon adjustment and other project emissions. A separate calculation assumes that all land made financially viable by methane is planted; see the impact page.
06
Metric Sources and Limits
The GWP20 factor 81.2 comes from IPCC AR6 Table 7.SM.7, which excludes methane-carbon accounting. The same table gives a GWP100 factor of 27.9. Our financial comparison keeps the model’s earlier factor of 27, the non-fossil GWP100 value from Table 7.15 with a different methane-carbon convention. For GWP*, we use 27 × (4qₜ − 3.75qₜ₋₂₀), following Cain et al. (2019).
We have not estimated the adjustment for carbon derived from methane. These quantities do not account for everything needed to calculate net project credits. If the dollar price per tonne of methane stays fixed, changing the reporting metric does not change cash flows or which land is financially viable. The GWP20 Q&A explains Google’s purchase of methane reductions from Terradot and what it means for bark methane.
For partners and investors
Request the Full Forest Finance Analysis
The full analysis is available under a nondisclosure agreement. It includes the methods, results at each price, all forest-protection calculations and tests of the assumptions. No registry credits bark methane today.